Pilgangoora — Can the Same Public-Data Workflow Read an Exposed Lithium Pegmatite?
Tolun AI · 2026-06-18 · blind public-data case study (Pilbara, Western Australia)
A companion to the Winu study, and a deliberate contrast. Winu is a covered Cu–Au porphyry where the geophysics had to do the work; Pilgangoora is an exposed LCT spodumene pegmatite, so the test is whether the same honest workflow correctly shifts its weight to whole-rock geochemistry and fractionation vectoring — the approach set out in Halley (2015). Built on 100% public data (Geoscience Australia grids + GSWA open-file geochemistry + GSWA mineral occurrences); no company data used. The headline: the method follows the deposit and its cover state — it is geochem-led here, geophysics-led at Winu — and we have now built a thermodynamic mineralogy engine that goes a step past mass balance alone.
1 · The deposit and the setting
Pilgangoora (Pilbara Minerals) is one of the world's largest hard-rock lithium deposits — albite–muscovite–spodumene LCT pegmatites in the Archean Pilbara Craton, within the East Strelley greenstone belt, ~97 km SSE of Port Hedland. Unlike Winu, it is exposed — there is no significant cover. That single fact flips which methods matter: the deposit's own chemistry reaches the surface, so whole-rock geochemistry becomes the primary vector, while the cover-piercing geophysics that carried Winu is secondary here.
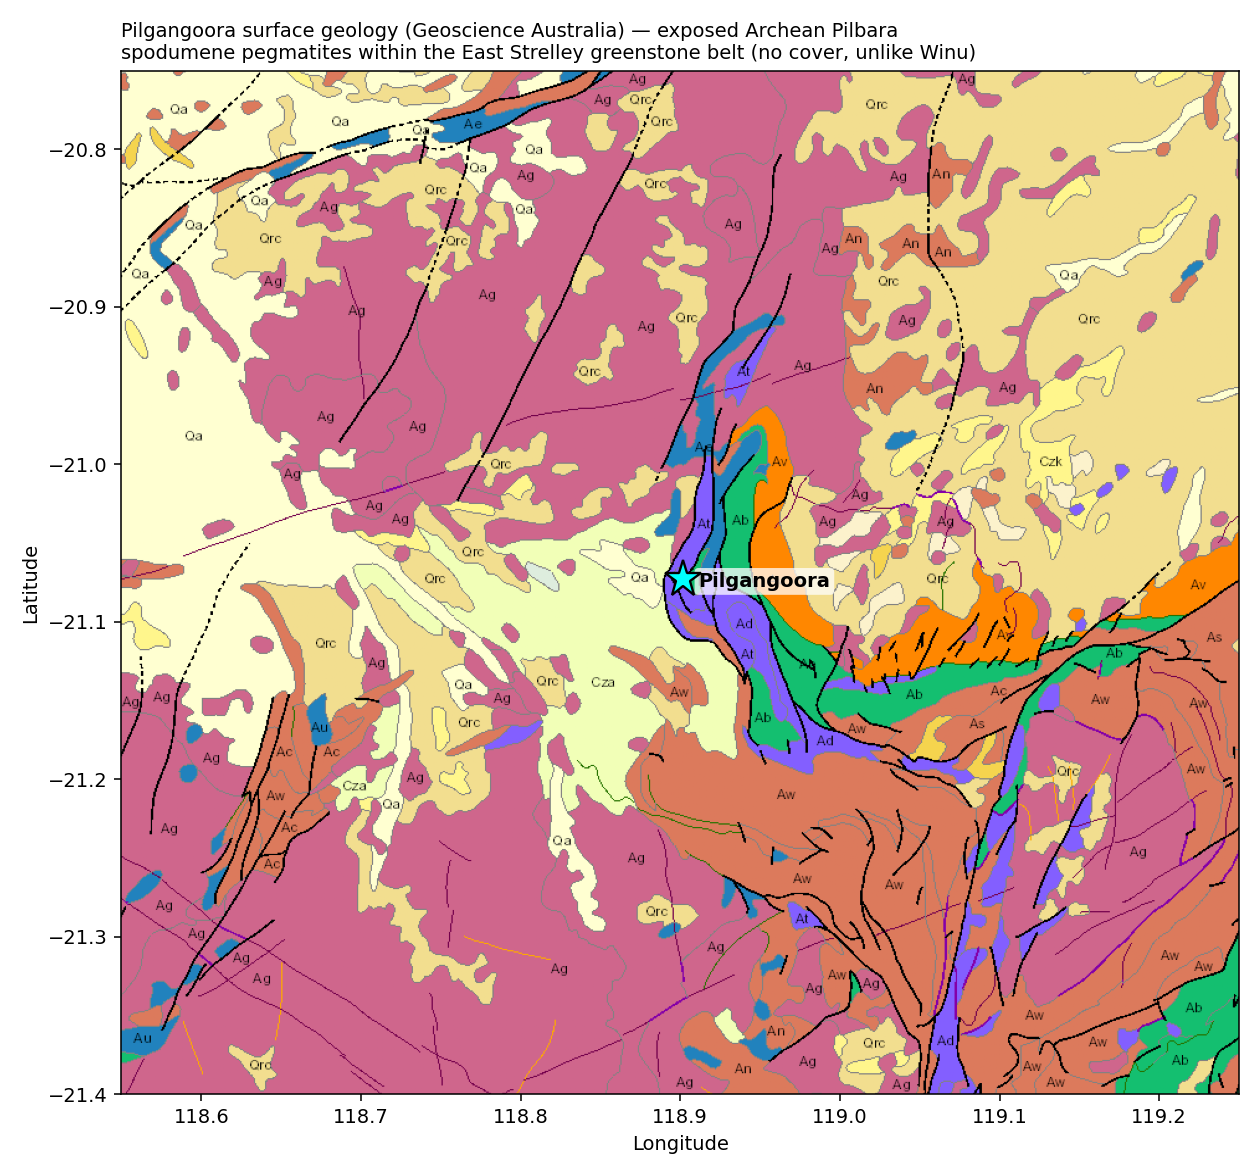 Figure 1. Surface geology (Geoscience Australia), Pilgangoora pinned — felsic intrusives and pegmatites set in a mafic (metabasalt) greenstone frame. Exposed bedrock, no cover.
(Coordinate verified: the authoritative GSWA mineral-occurrence centroid is −21.07282, 118.90167 — we used that, after finding a widely-quoted web coordinate sat ~1.5 km off, on the mafic host rather than the pegmatite. Same verify-before-claiming discipline as the Winu study.)
2 · Method — public data only, blind
- Located the window from the verified deposit coordinate — a 0.70° × 0.65° box (lon 118.55–119.25, lat −21.40 to −20.75).
- Geophysics — GA 2019 national grids via WCS: Bouguer gravity, magnetics (1VD, analytic signal), radiometrics (K, Th, U).
- Surface geology — GA Surface Geology REST export.
- Geochemistry — GSWA open-file WACHEM: 309 whole-rock samples in the window, with the full LCT-pathfinder suite populated (Li, Rb, Cs, Ta, Nb, Sn, Be, F) plus major oxides.
- Mineral occurrences — GSWA MinOccView: 454 occurrences (162 LCT-pegmatite: Li/Ta/Sn) as prospectivity labels.
- Remote sensing — ASTER mineral maps (Australian ASTER Geoscience Maps, CSIRO/GA via NCI GSKY; AlOH white-mica composition & content, 31 m) and Sentinel-2 band ratios (20 m); EMIT (NASA spaceborne hyperspectral, L2B mineralogy) pulled (2025-10-30 scene) and processed to white-mica band depth (see §5). Copernicus DEM / Sentinel-1 SAR available for structure.
3 · Regional geophysics (deposit pinned)
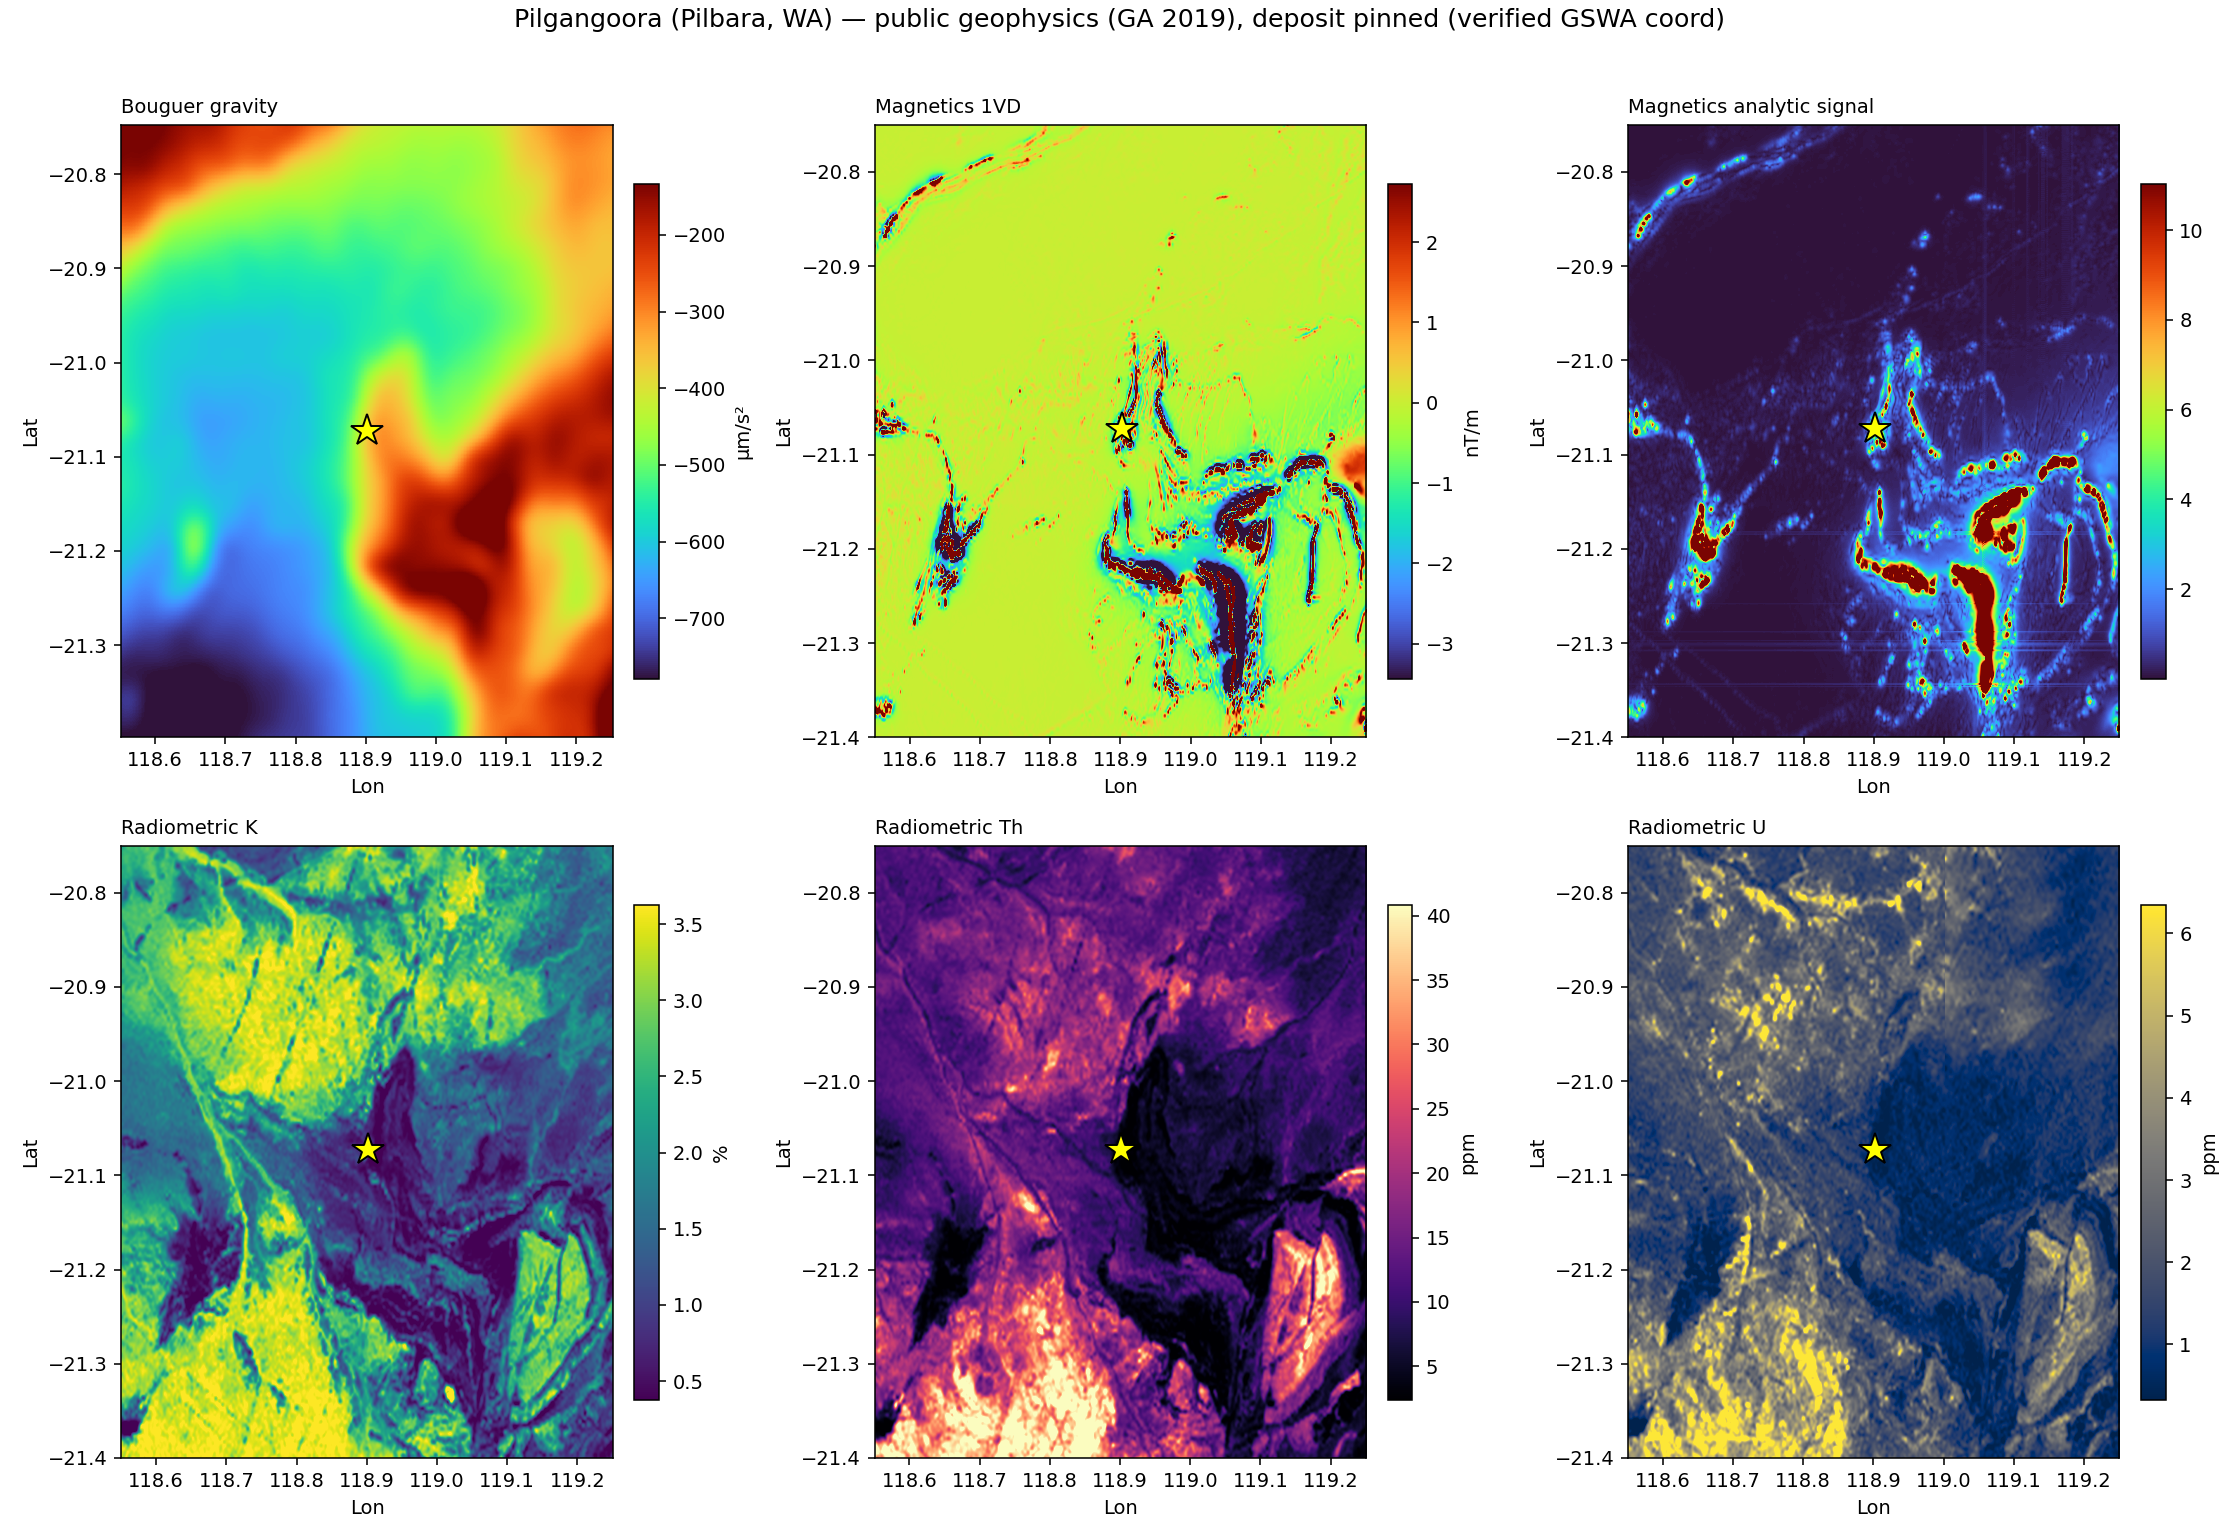 Figure 2. Gravity, magnetics (1VD, analytic signal), and radiometrics (K, Th, U), Pilgangoora pinned.
4 · The signature, and the honest ranking
| Layer | Value at Pilgangoora | Field percentile | Reads as |
|---|---|---|---|
| Magnetics — 1VD / AS | 6.4 / 8.4 | 99 / 97 % | the mafic greenstone host belt, not the pegmatite (pegmatites are non-magnetic) |
| Bouguer gravity | −383 | 66 % | neutral |
| Radiometric K / Th / U | 0.74 / 3.4 / 0.41 | 11 / 5 / 3 % | low — albite-spodumene pegmatite is K-depleted; mafic host is low-K |
| Whole-rock geochem | Li 10,811 ppm, K/Rb→20 | top of field | decisive — the fertile pegmatite is unambiguous |
| ASTER white-mica (AlOH composition) | phengitic muscovite | 99th % | independent spectral corroboration of the fertile mica (31 m) |
Ranking for this (exposed) deposit — the mirror of Winu:
| Rank | Layer | Contribution |
|---|---|---|
| 1 | Geochem (Li/Rb/Cs/Ta + K/Rb fractionation) | High — decisive; pinpoints the fertile pegmatite |
| 2 | ASTER white-mica (AlOH composition) | High — independent spectral corroboration of the fertile mica (top ~1 %, 31 m) |
| 3 | Magnetics | Medium — maps the fertile greenstone terrane (host), not the orebody |
| 4 | Radiometrics | Low–Med — K-depletion is a (weak) negative indicator |
| 5 | Gravity | Low — neutral |
| — | Sentinel-2 / DEM | structural framework only — broadband can't resolve the LCT minerals, and mine disturbance leaks near the pit |
At Winu, geophysics ranked first and geochem was regional-only. Here it is reversed. The method follows the deposit and its cover state — it is not a fixed recipe. That is the cross-study lesson, and the honest one.
5 · Geochemistry — LCT fractionation vectoring (the discriminator)
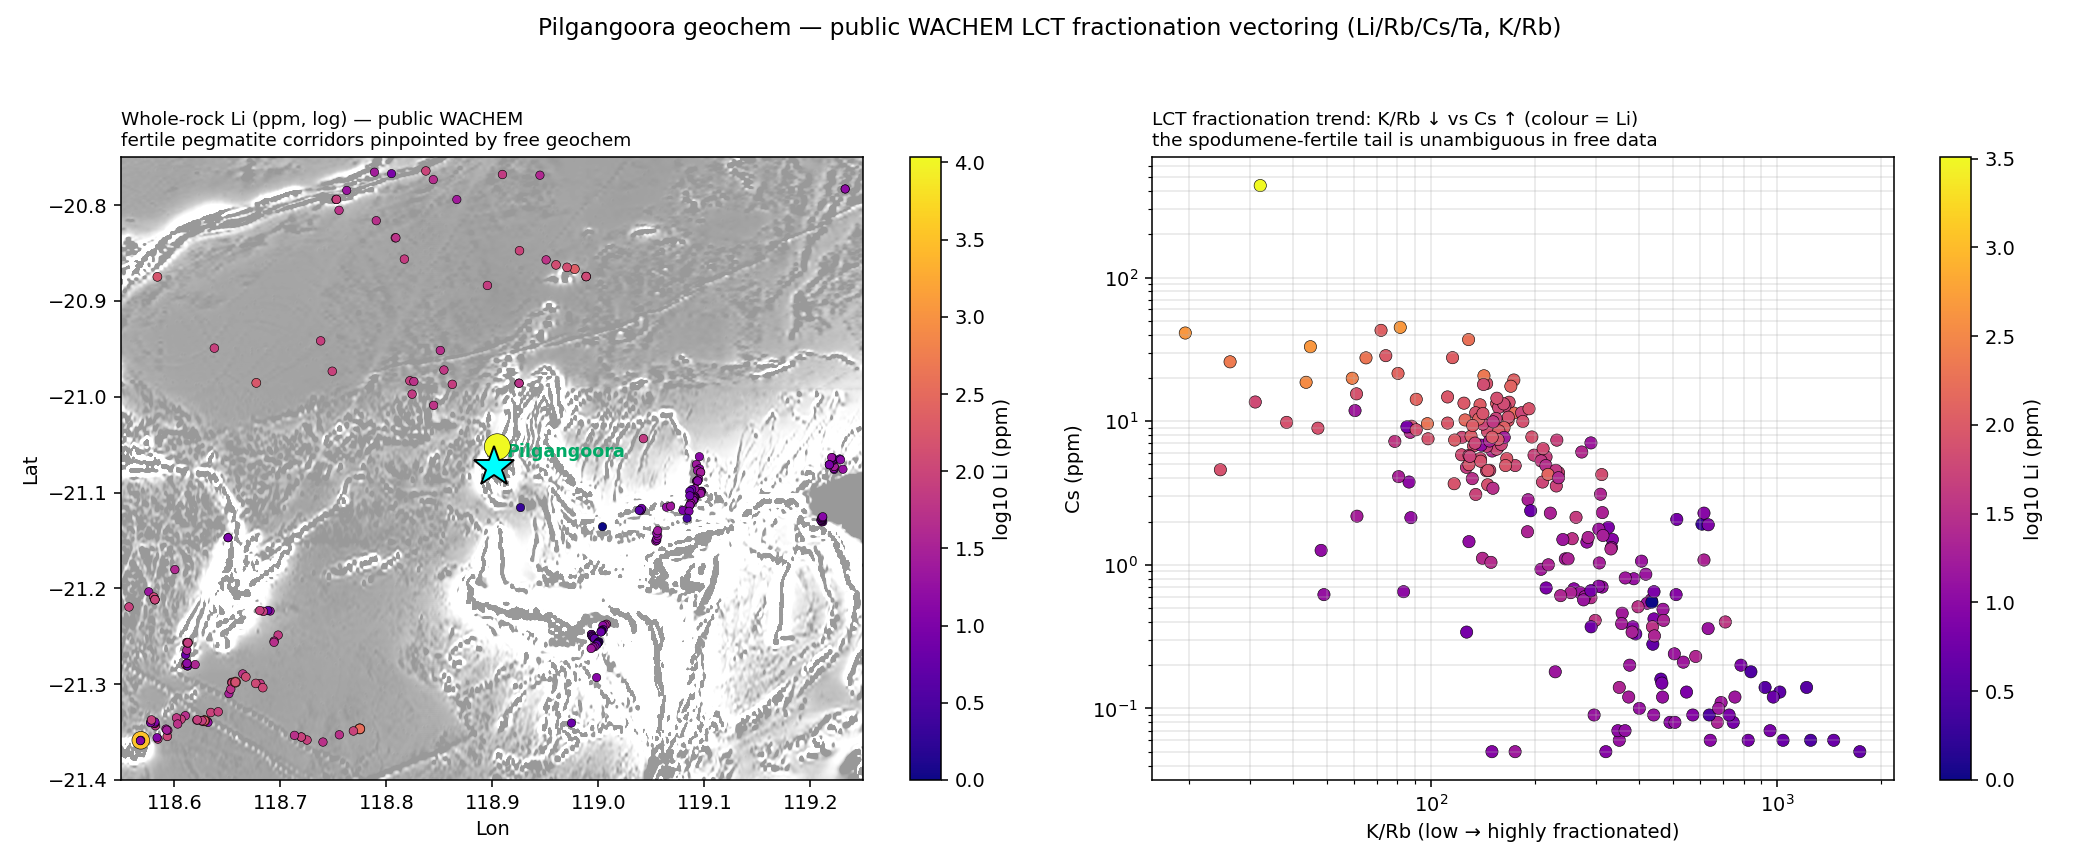 Figure 3. Left: whole-rock Li (log) over the window — the fertile pegmatite corridors light up. Right: the LCT fractionation trend (K/Rb ↓ vs Cs ↑, coloured by Li) — the spodumene-fertile tail is unambiguous in free data.
Public WACHEM carries the complete fractionation suite: Li to 10,811 ppm (~2.3 % Li₂O), Rb to 6,015, Cs to 437, Ta to 69 ppm, and K/Rb down to ~20 (extreme fractionation). This is exactly the lithogeochemical vectoring described in Halley (2015), "Geochemistry, the new geophysics?" — and for an exposed LCT pegmatite it is the primary exploration tool. The free data alone identifies the fertile, highly-fractionated zones.
Spectral alteration — ASTER white-mica (corroborating the geochem)
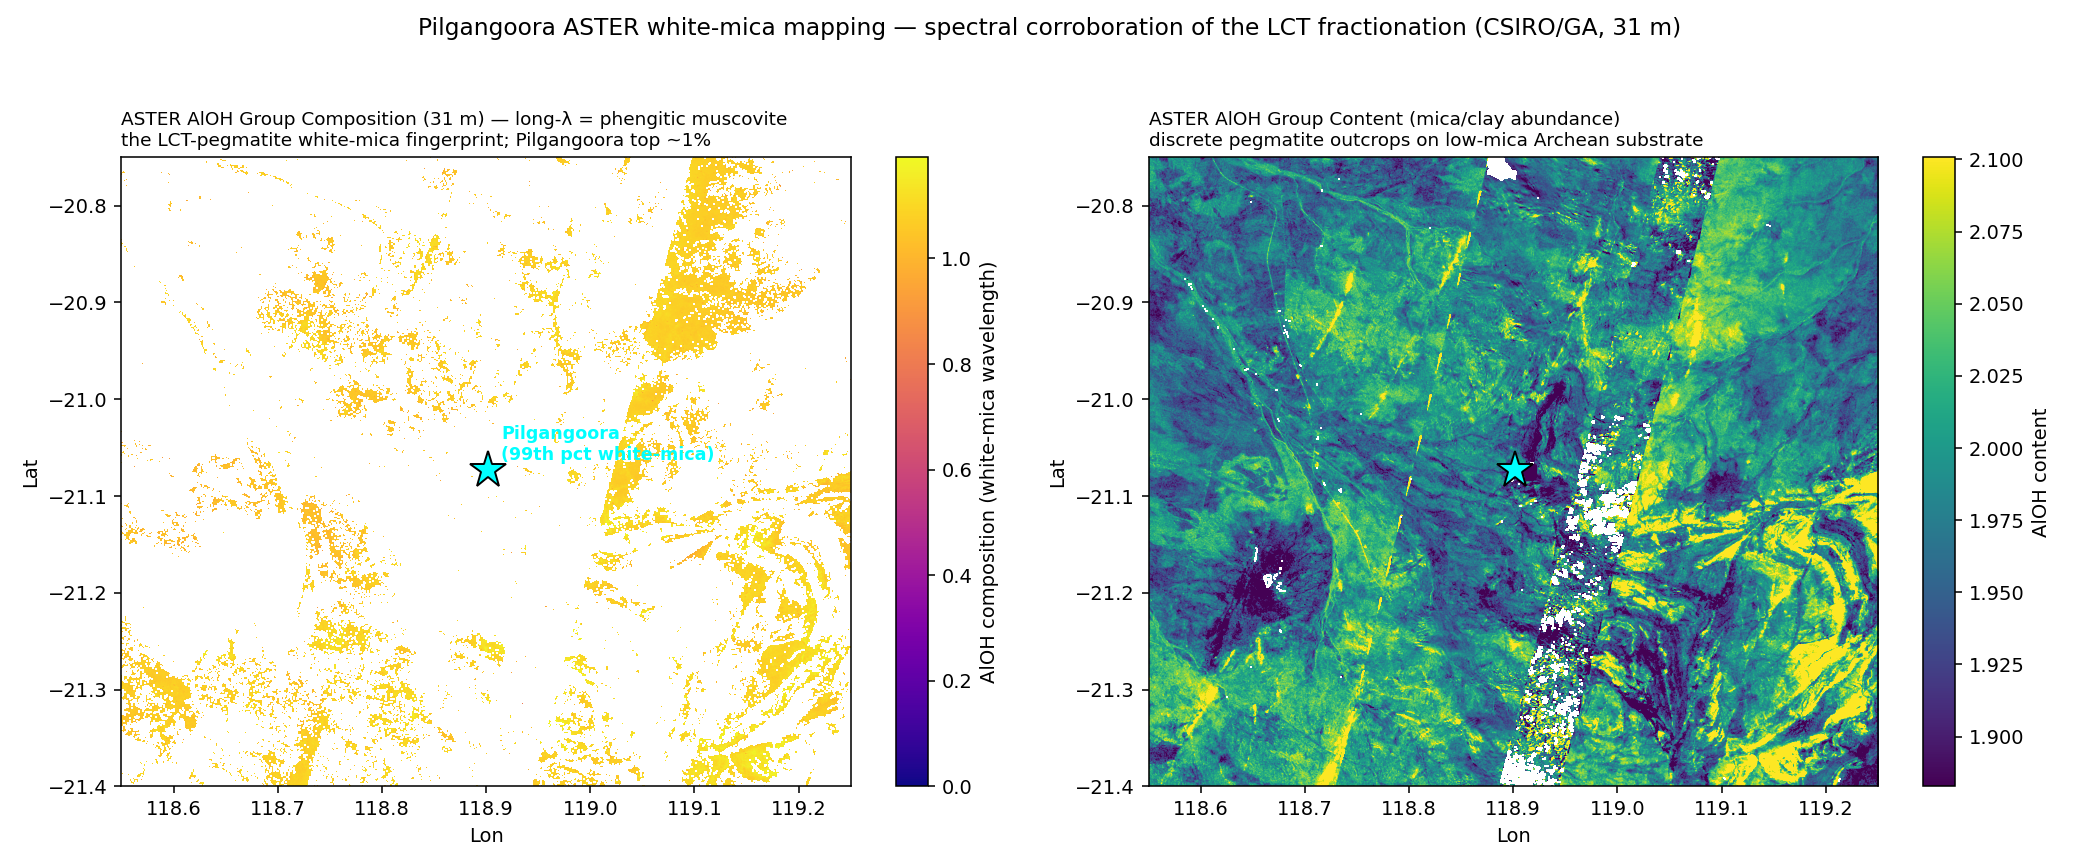 Figure 4. ASTER AlOH composition (left, 31 m) and content (right), Pilgangoora pinned (CSIRO/GA). Long-wavelength AlOH = phengitic muscovite — the LCT white-mica fingerprint.
Independent of the assays, the public ASTER mineral maps put Pilgangoora in the top ~1 % of the window for AlOH (white-mica) composition — long-wavelength phengitic muscovite — on an otherwise low-mica Archean substrate. That is the spectral fingerprint of a muscovite-bearing LCT pegmatite, and it corroborates the geochemical fractionation from a completely different sensor. (Honest handling: AlOH content is low/sparse here — the mica is in discrete outcrops, not pervasive cover — so the composition anomaly is read over a ~250–500 m radius, not single pixels.) (The co-pulled ASTER ferrous-iron-in-MgOH index is unremarkable at Pilgangoora — ~72nd percentile, tracking the mafic greenstone host rather than the pegmatite — so AlOH white-mica composition is the discriminator here.)
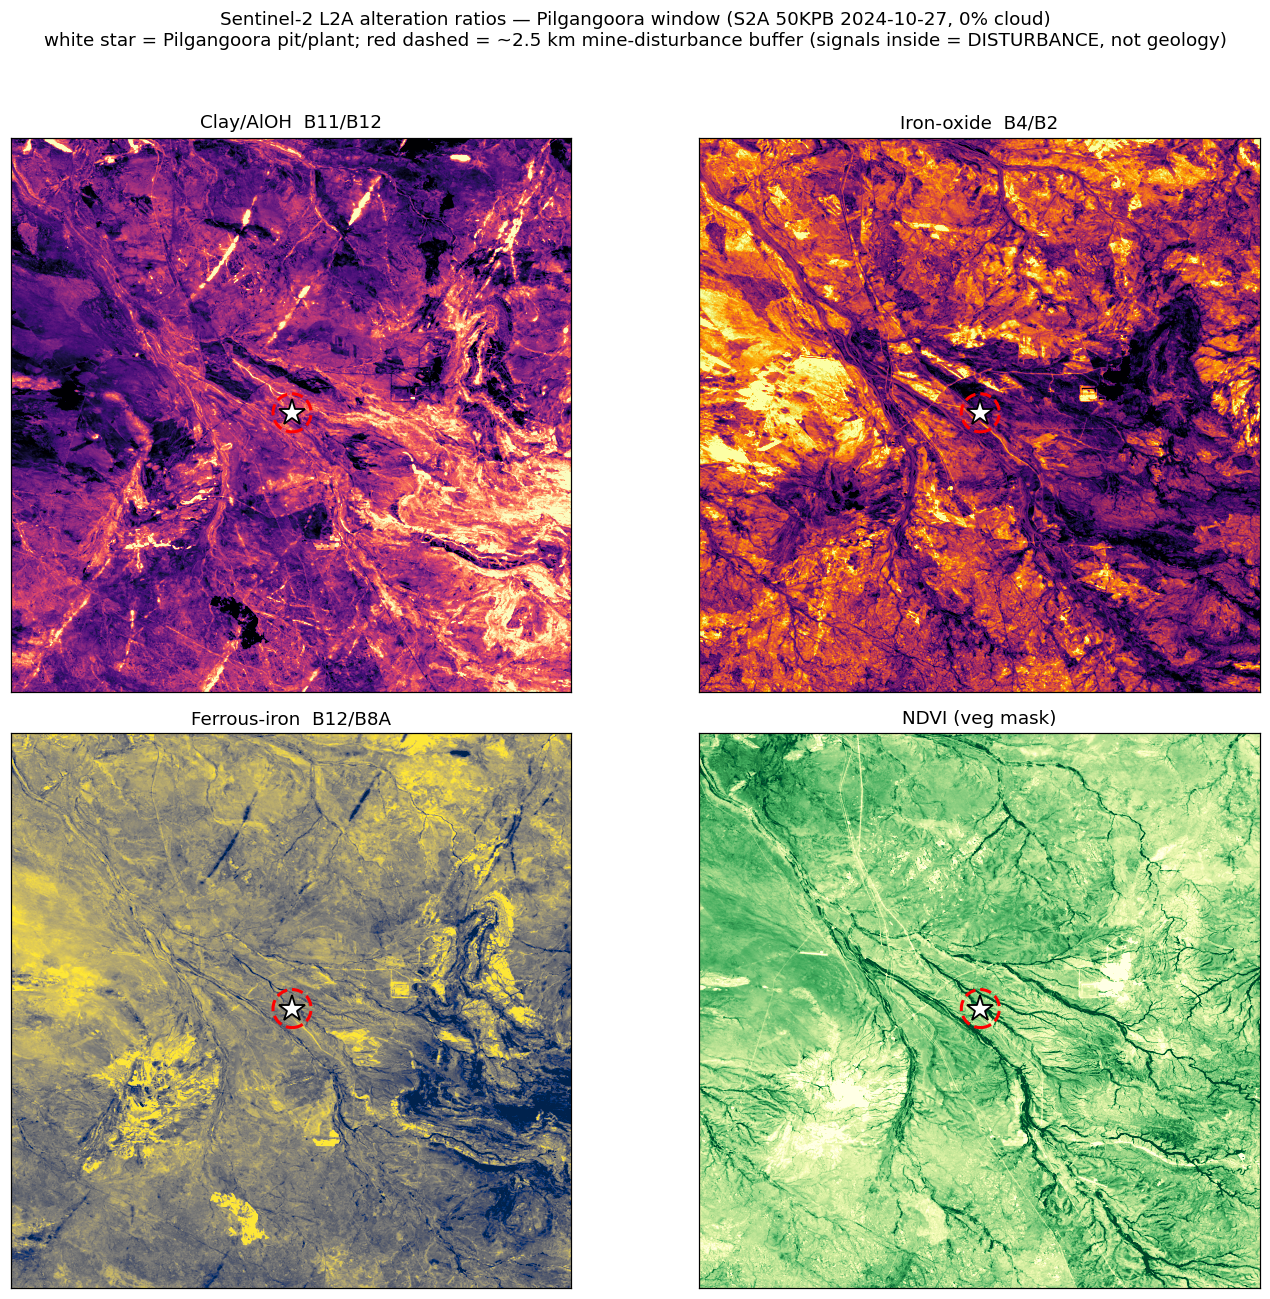 Figure 5. Sentinel-2 band ratios (clay/AlOH, iron-oxide, ferrous; 20 m). The value here is the regional NW–SE structural fabric — broadband S2 cannot resolve the LCT minerals, and the deposit itself does not stand out.
Two honest caveats on the remote sensing. (1) Operating-mine leakage: Pilgangoora is a producing mine, so any signal within ~2.5 km of the pit/plant/tailings is disturbance, not in-situ geology — interpret the regional pattern only (tellingly, the Sentinel-2 ratios at the mine sit at or below the regional median). (2) Broadband Sentinel-2 cannot resolve the diagnostic LCT minerals (spodumene/muscovite/albite need narrow SWIR) — that is what ASTER, and especially EMIT, provide. EMIT (NASA spaceborne imaging spectrometer, 60 m direct mineral ID) — now pulled — sharpens the lesson rather than the target: at the exact deposit pixel EMIT identifies mine infrastructure ("Coated Steel Girder"), mafic rock and Fe-oxide — not muscovite (white-mica band depth ≈ 0). That is the operating-mine leakage trap proven empirically: the pit is disturbance-dominated, while genuine white-mica anomalies sit regionally, off the mined footprint. (ASTER's coarser 31 m broadband flagged a high by averaging the surrounding mica; EMIT's 60 m per-pixel mineral-ID at the disturbed pit sees the steel. Both are honest — the mismatch is the finding, and it validates why we mask the mine.)
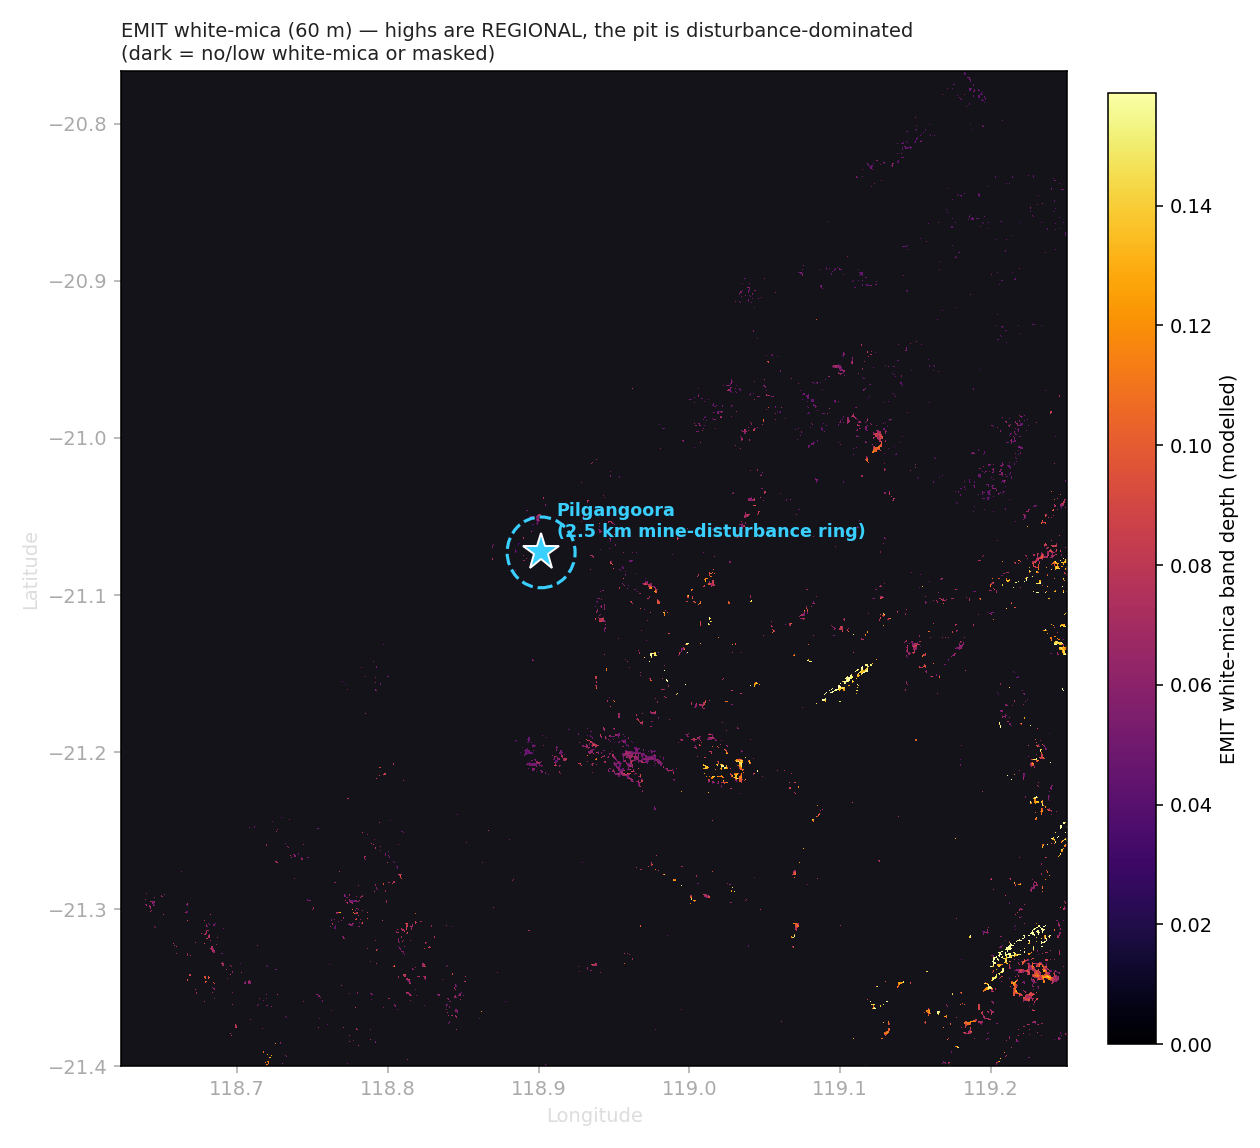 Figure 6. EMIT modelled white-mica band depth (60 m), Pilgangoora pinned with a 2.5 km mine-disturbance ring — the deposit pixel is disturbance-dominated; white-mica highs are regional, off the footprint. Copernicus DEM (30 m) and Sentinel-1 SAR are available for structural corroboration.
6 · Thermodynamic mineralogy — a step past mass balance
Mass-balance methods convert assays to mineralogy. We built that (a non-negative least-squares mass balance, and a Bayesian DRAM-MCMC version that returns mineralogy with uncertainty, which mass balance alone does not). For this study we went one step further and built the thermodynamic layer: a constrained Gibbs free-energy minimization with ideal solid-solution mixing (feldspar, mica), which finds the assemblage that minimizes total Gibbs energy subject to the measured bulk composition — and so predicts the stable lithium phase (spodumene vs petalite), the single most important control on lithium processing.
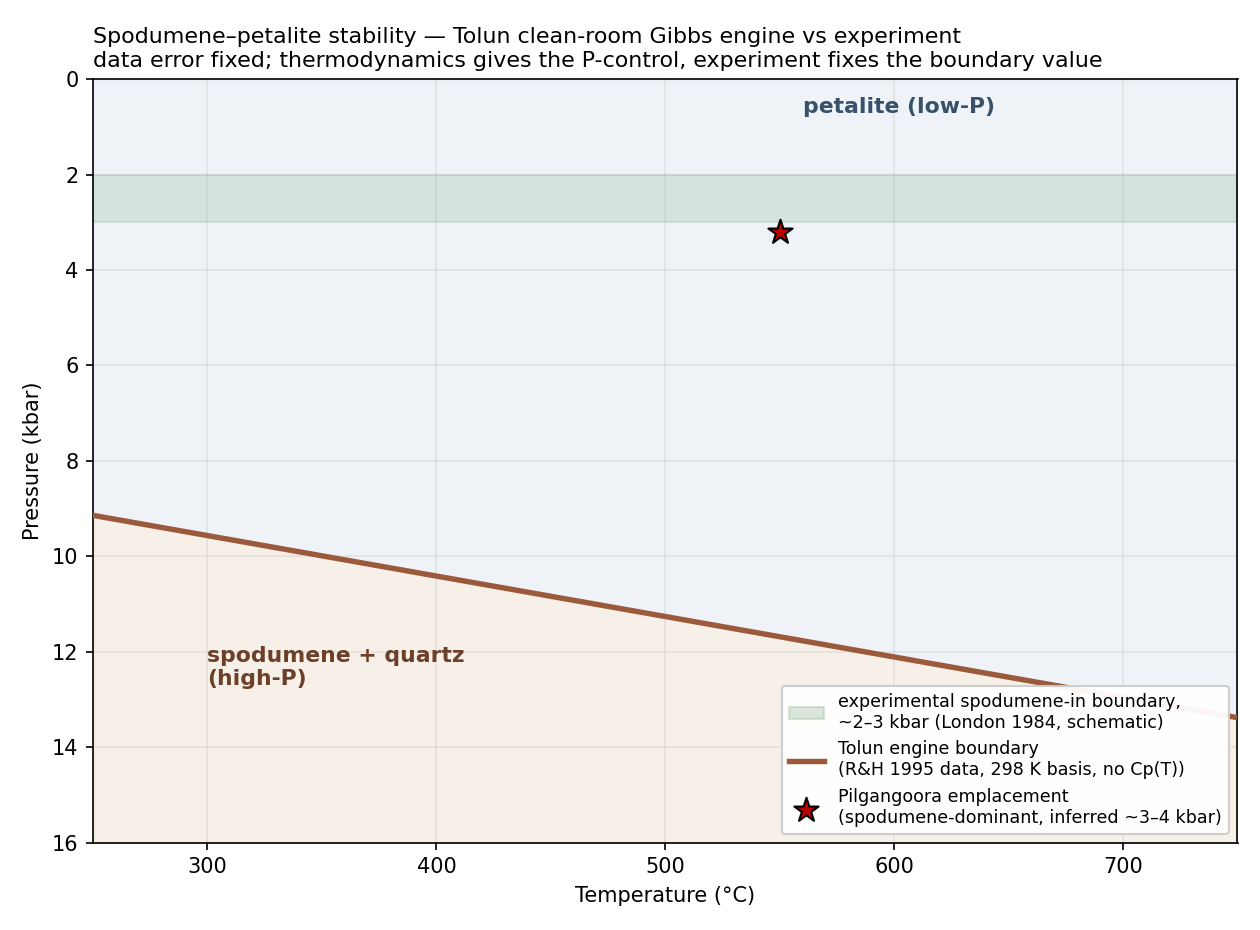 Figure 7. Tolun's clean-room Gibbs engine: the spodumene + quartz / petalite stability boundary in pressure–temperature, computed from Tolun's own public-domain thermodynamic dataset (Robie & Hemingway 1995, USGS Bulletin 2131). The engine reproduces the correct control — rising pressure favours spodumene (the reaction has positive ΔV) — and the computed boundary (clay line) is read honestly against the experimentally-bracketed field (~2–3 kbar, green band, London 1984) and Pilgangoora's inferred emplacement conditions (star).
Honest result — and it now rests entirely on Tolun's own data. We rebuilt the thermodynamic layer as a clean-room engine: a Tolun-authored Gibbs-energy minimization reading our own end-member dataset, hand-transcribed from Robie & Hemingway (1995, USGS Bulletin 2131) — a U.S. Government public-domain compilation — with no third-party scientific engine anywhere in the path. Re-validating it caught a real bug worth reporting: the earlier prototype carried a petalite ΔfG° wrong by ~357 kJ/mol — large enough on its own to flip the very phase the engine exists to predict. With the corrected, citable data the picture is both honest and sharp: (i) the engine reproduces the correct control — the reaction spodumene + 2 quartz = petalite has ΔV = +24.65 cm³/mol, so rising pressure favours spodumene, exactly the physics; (ii) but from a 298 K basis (no heat-capacity integration) the computed boundary sits near ~10–11 kbar, still favouring petalite at pegmatite pressure, because the reaction's ΔG (≈ −18 kJ/mol at 1 bar) is within the combined uncertainty of the formation enthalpies (petalite ±6.3, spodumene ±2.8 kJ/mol). The spodumene↔petalite call genuinely turns on a few kJ — below the resolution of from-room-temperature thermodynamics. So the experimentally-bracketed boundary (London 1984: spodumene + quartz stable above ~2–3 kbar) is the calibration authority, and Pilgangoora's spodumene dominance is consistent with emplacement above it. The takeaway is the honest one: thermodynamics supplies the control (pressure drives spodumene); the experimental brackets fix the value (the boundary pressure). We did not tune the data to the known answer — and engine, data, and conclusion are now wholly Tolun-owned and public-domain-sourced.
7 · Prospectivity (learned, all layers)
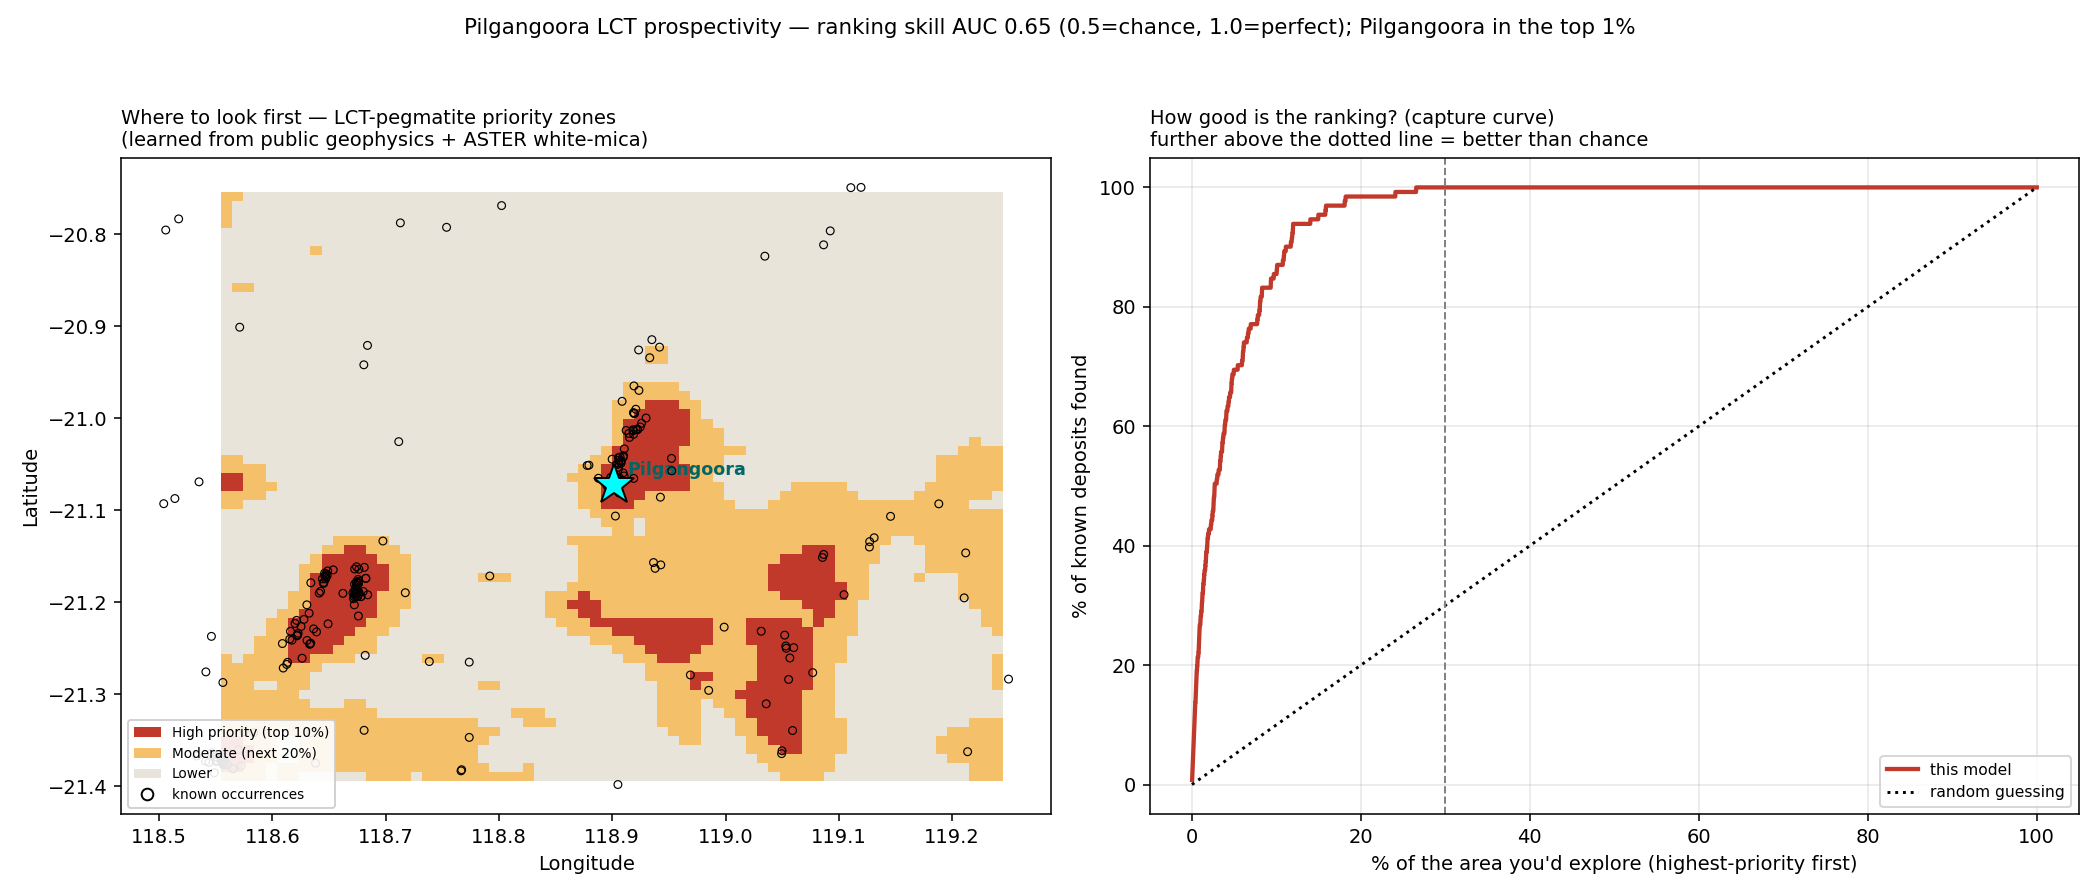 Figure 8. Left — LCT-pegmatite priority zones (red = top 10 %, explore first; orange = next 20 %; beige = lower), learned by RF + PU-bagging from public geophysics plus the ASTER white-mica feature, labelled by the known occurrences. Right — the capture curve: how much of the known endowment you find as you explore the highest-priority ground first.
- Pilgangoora sits in the top ~1 % of the window. Ranking skill is AUC ≈ 0.65. (AUC — "area under the ROC curve" — is how reliably the model ranks a real deposit above a random location: 0.5 = no better than a coin toss, 1.0 = perfect. 0.65 means modestly better than chance — a screening aid to prioritise ground, not a decision.) Better than Winu's 0.57 (more positives, more distinctive LCT signatures); adding the ASTER white-mica feature lifted it only marginally (0.64 → 0.65) — the geophysical terrane signature still dominates, honestly.
- Top features: magnetic analytic signal, radiometric Th and K, gravity — the model leans on the terrane signature (greenstone-hosted, K-systematics), consistent with the ranking.
- Caveat: the 237 LCT-labelled occurrences (162 with Li/Ta/Sn commodity tags, plus pegmatite-mineral-name matches) are heavily clustered (Pilgangoora / Wodgina / Mt Francisco / Lynas Find) — strong spatial autocorrelation, so the in-sample capture (top 30 % → 100 %) is optimistic; the cross-validated AUC is the number to trust.
8 · Comparison to the known model
Pilgangoora is a documented albite–spodumene LCT pegmatite. The public data recovers exactly that signature: extreme geochemical fractionation (K/Rb, Cs, Li, Ta), a K-depleted radiometric response, a magnetic expression that is the host greenstone rather than the (non-magnetic) pegmatite, and an equilibrium mineralogy dominated by quartz–albite–mica with a lithium phase whose identity is pressure-sensitive. Model-consistent throughout, on free data.
9 · The honest limits
- Ore-grade samples are Li-only. The highest-grade Pilgangoora rock-chips (Li > 10,000 ppm) carry no whole-rock major oxides, so the thermodynamic/mass-balance mineralogy at true ore grade used a labelled representative bulk; the real whole-rock samples are moderate-grade.
- Thermodynamic phase selection needs calibration. From a 298 K basis (no Cp(T) integration), Tolun's clean-room engine puts the spodumene↔petalite boundary near ~10–11 kbar — favouring petalite at pegmatite pressure (Section 6) — because the reaction energy is within the formation-enthalpy uncertainty. The experimentally-bracketed boundary (London 1984) is the authority on the boundary value; full Cp(T)-integrated thermodynamics is the next calibration step. All data is public-domain and Tolun-owned.
- Prospectivity is clustered and label-biased — AUC ≈ 0.65; the occurrences mark explored ground.
- Magnetics marks the terrane, not the orebody — a greenstone-belt high is necessary context, not a target.
10 · Where Tolun adds value
For an exposed LCT pegmatite the public data goes a long way on its own — but the platform adds what free data cannot: (1) thermodynamically-consistent, uncertainty-bounded mineralogy (the Gibbs-min engine + DRAM uncertainty — the same mass-balance chemistry, plus thermodynamics and uncertainty), pointing directly at the spodumene-vs-petalite-vs-lepidolite processing question; (2) integration of geochemistry, geophysics and structure into a ranked, uncertainty-native target list; and (3) Tolun's own clean-room thermodynamic engine (public-domain Robie & Hemingway data + experimental P–T brackets) that turns "a Li phase is stable" into "spodumene, at this grade, at this pressure, with this confidence."
11 · Net
On 100 % public data, the exposed Pilgangoora LCT system is read primarily by geochemistry — extreme fractionation (Li 10,811 ppm, K/Rb → 20) pinpoints the fertile pegmatite, while magnetics maps only the host greenstone and radiometrics register K-depletion. This is the mirror of Winu, where cover forced a geophysics-led read — proof that the workflow adapts to the deposit rather than imposing a recipe. And we have built the thermodynamic mineralogy engine (Gibbs-min + solid solutions) on Tolun's own clean-room dataset (public-domain Robie & Hemingway 1995, USGS) — taking the geochemistry-to-mineralogy chain a clear step past mass balance alone: chemistry → thermodynamically-consistent mineralogy → uncertainty → processing implications.
References (public sources)
- ASTER white-mica mapping — Australian ASTER Geoscience Maps (CSIRO/GA) via NCI GSKY WCS (gsky.nci.org.au/ows/aster), AlOH Group Composition/Content, 31 m.
- Sentinel-2 L2A band ratios via STAC (earth-search.aws.element84.com); EMIT L2B mineralogy (NASA LP DAAC, EarthData login) — scene EMIT_L2B_MIN_001_20251030T023413_2530302_026 (2025-10-30), downloaded & processed to white-mica band depth.
- Copernicus DEM 30 m; Sentinel-1 SAR (Microsoft Planetary Computer).
- Geoscience Australia — 2019 national geophysical grids (gravity, magnetics, radiometrics), WCS; Surface Geology REST service.
- GSWA open-file WACHEM multi-element geochemistry (DMIRS-047) via SLIP; GSWA MinOccView mineral occurrences (geossdi.dmp.wa.gov.au).
- Halley, S. — "Geochemistry, the new geophysics?", ASEG Extended Abstracts, 2015.
- Thermodynamic mineralogy: constrained Gibbs free-energy minimization with ideal solid-solution mixing (Tolun
met_predictor, clean-room — Tolun-authored, no third-party scientific engine). End-member thermodynamic data: Robie, R.A. & Hemingway, B.S. (1995), Thermodynamic Properties of Minerals and Related Substances at 298.15 K and 1 Bar…, USGS Bulletin 2131 (U.S. Government work, public domain). Spodumene/petalite/eucryptite P–T stability brackets: London, D. (1984), Am. Mineral. 69:995–1004; Bennington (1982). - Pilgangoora geology & mineralogy — PorterGeo (mineid mn1535); Pilbara Minerals public disclosures.
Implementation: ~/tolun_geophys_data/li_case/ and ~/tolun_geophys_data/met_predictor/. Tolun AI is the engine; Dr Fatimah Abdulghafur is Competent Person of record. © Tolun AI 2026.